Disclaimer: Data contained in this example does not based on statistically valid sample, and made solely for the purpose of demonstrating the end product.
Has been at Upwork for 6 years, starting Sep 04, 2017
Number of hours worked - 1384.0
Hourly rate stats:
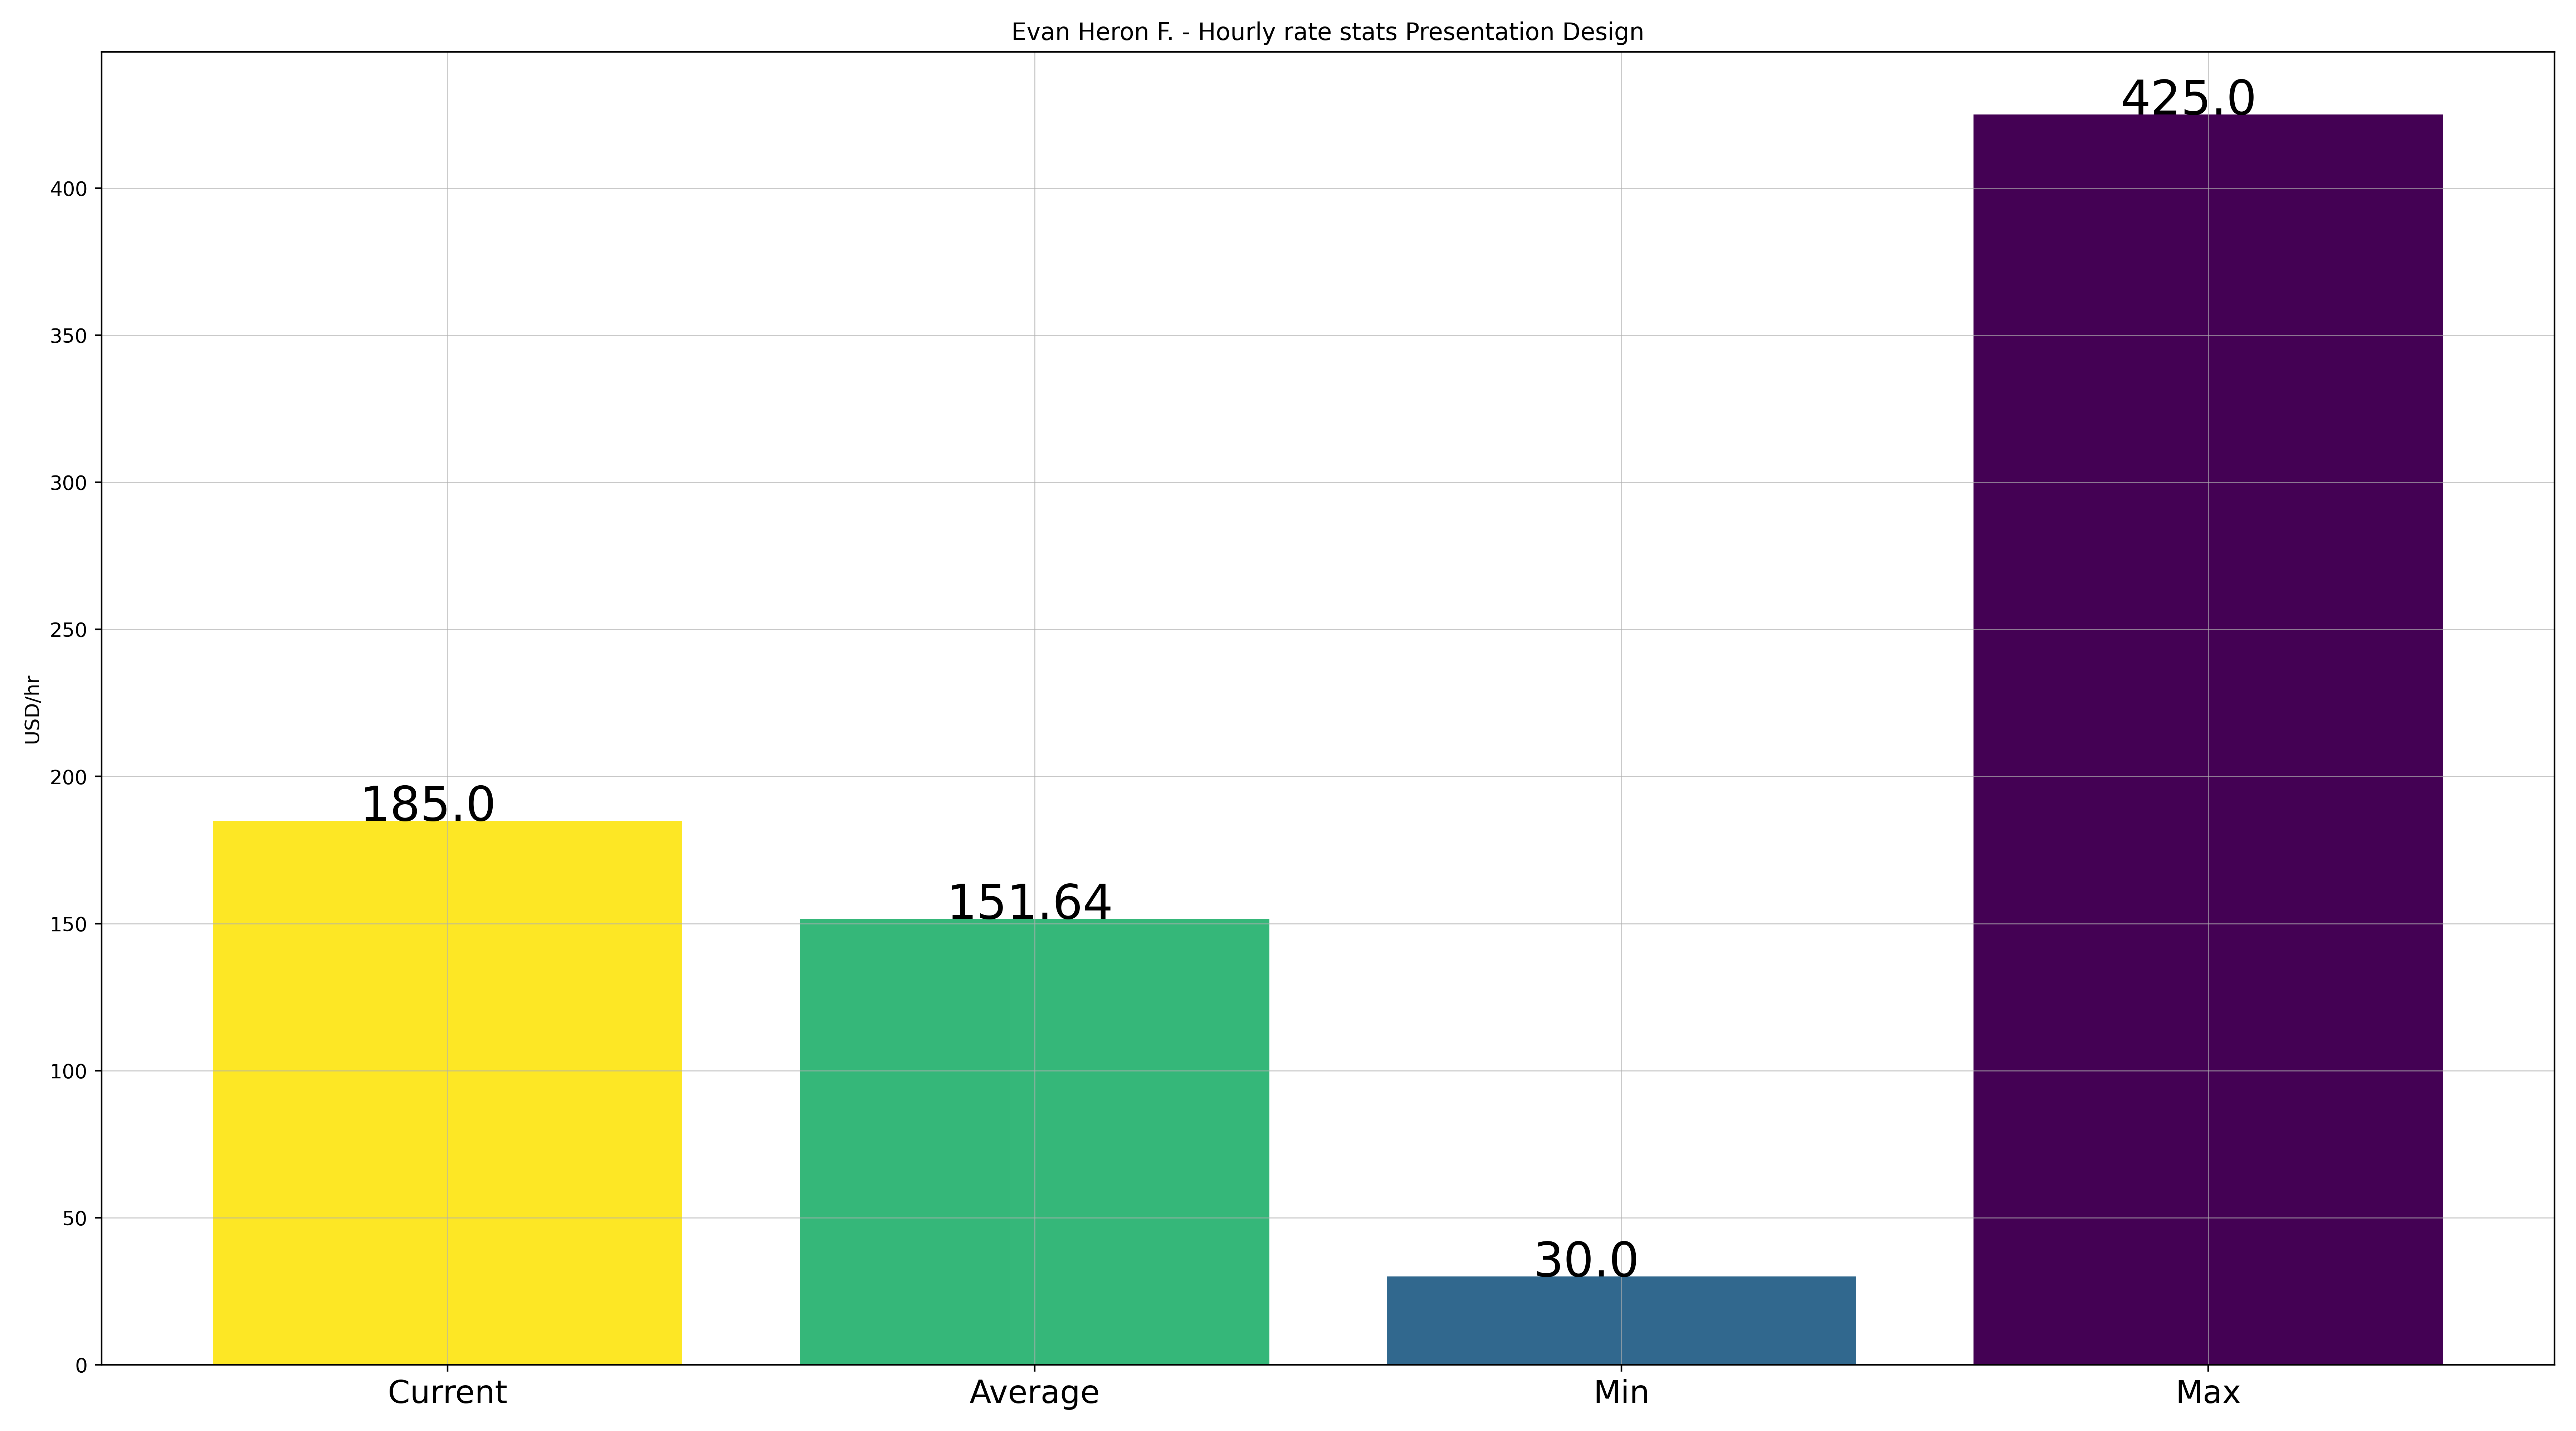
- Current - 185.0 $/hr
- Average - 151.64 $/hr
- Min - 30.0 $/hr
- Max - 425.0 $/hr
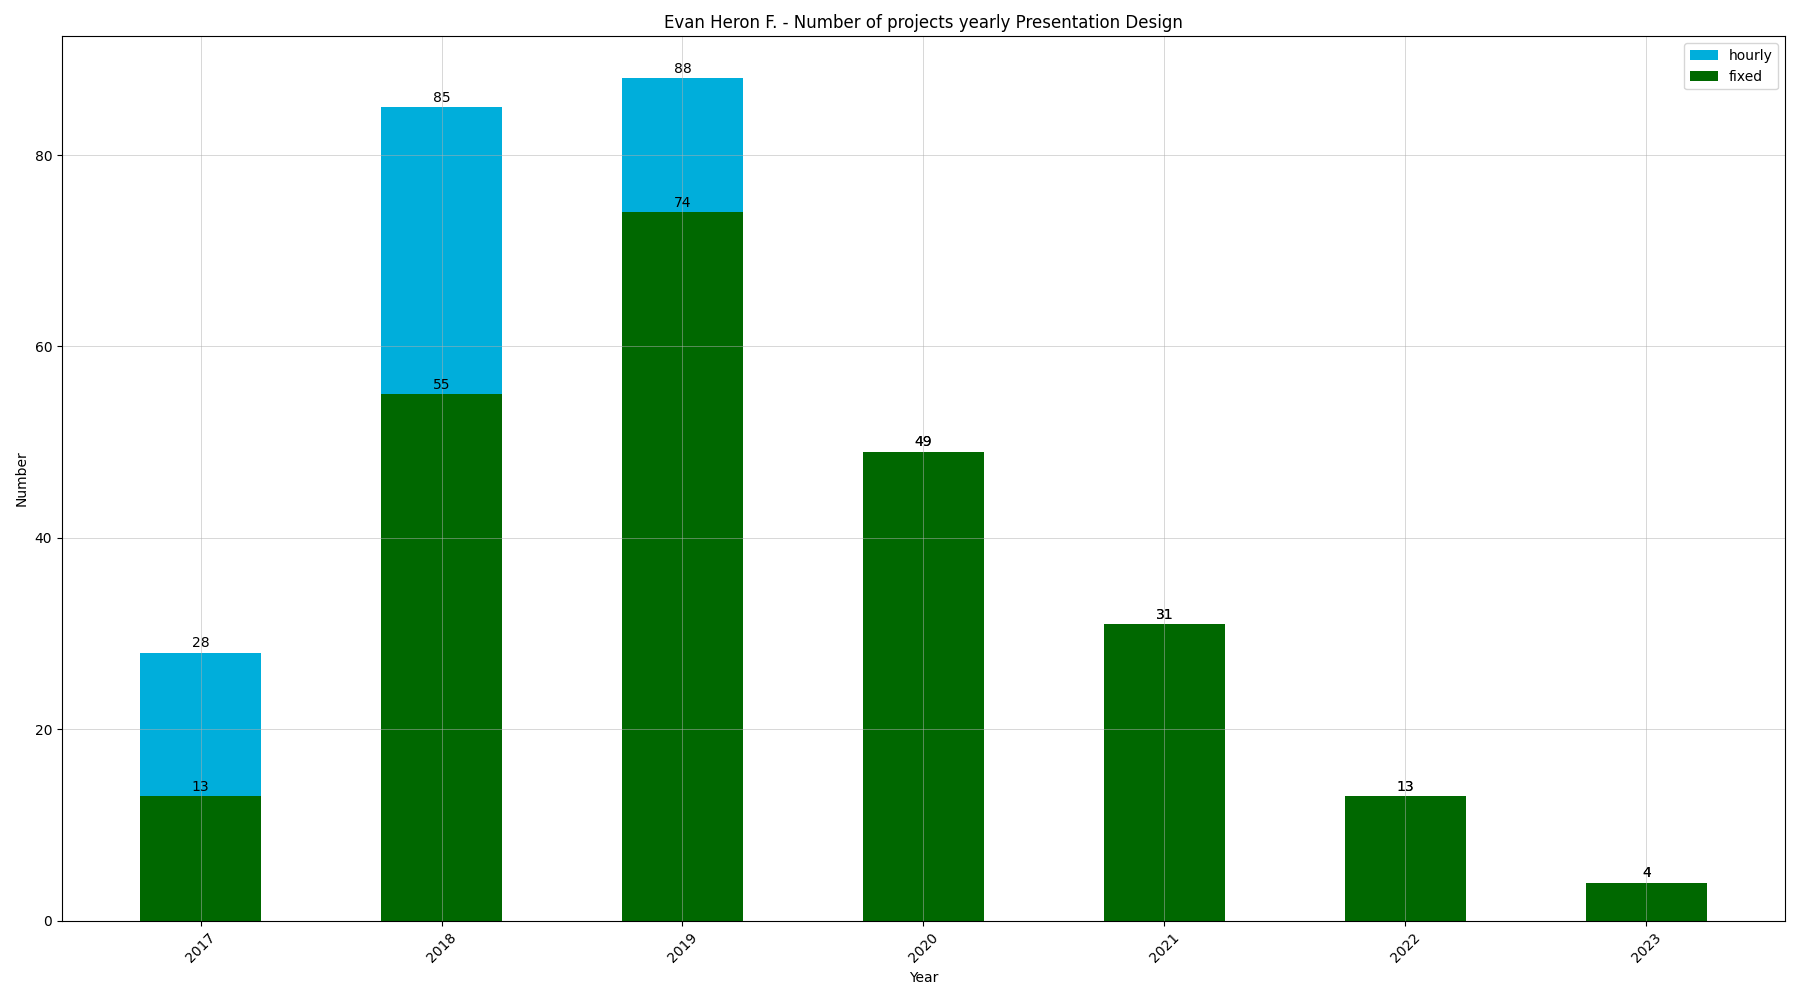
Number of projects:
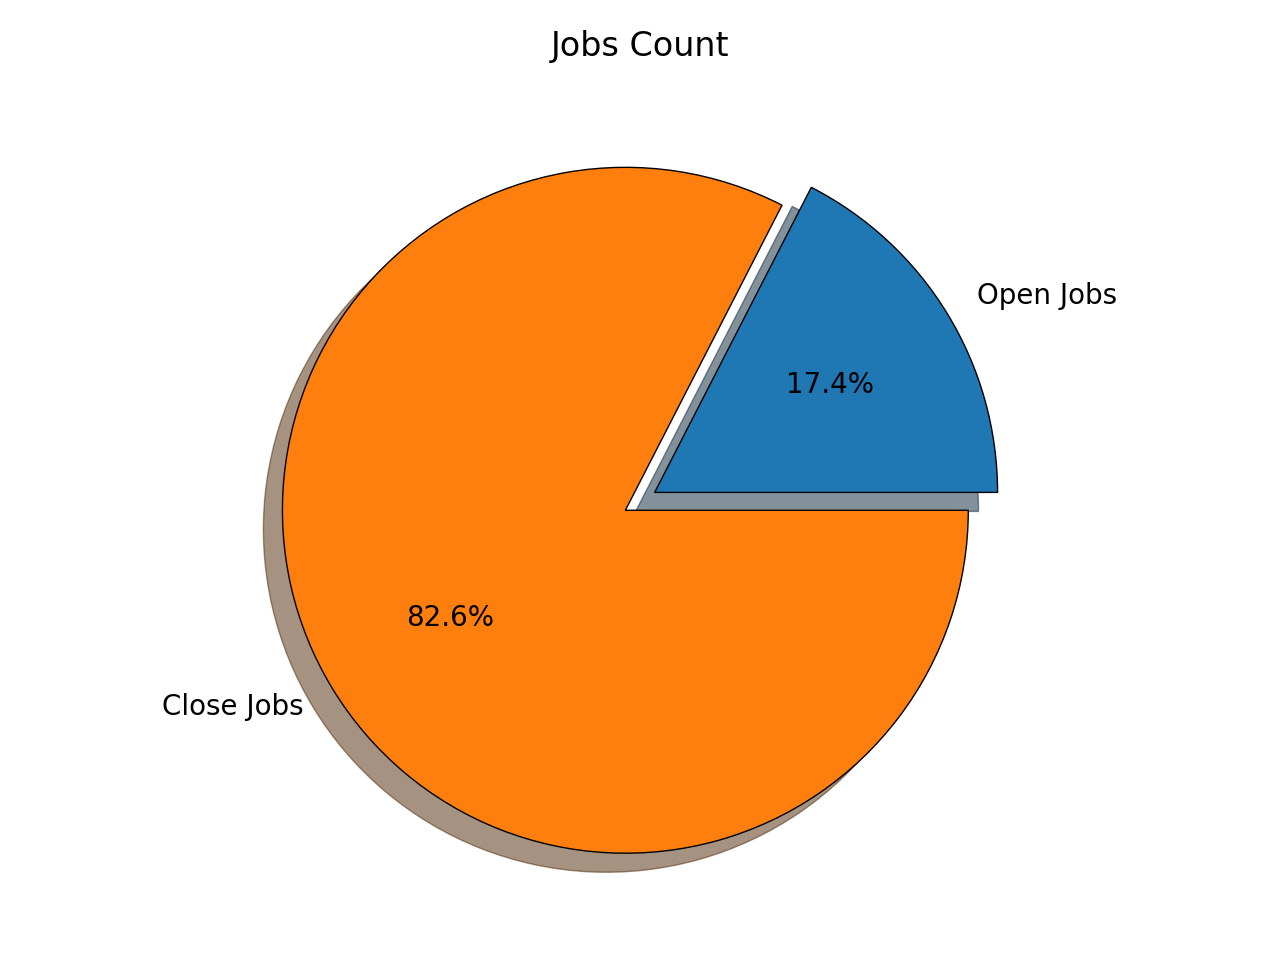
- Closed projects - 246
- Open projects - 52
- All projects - 298
Amount of earnings:
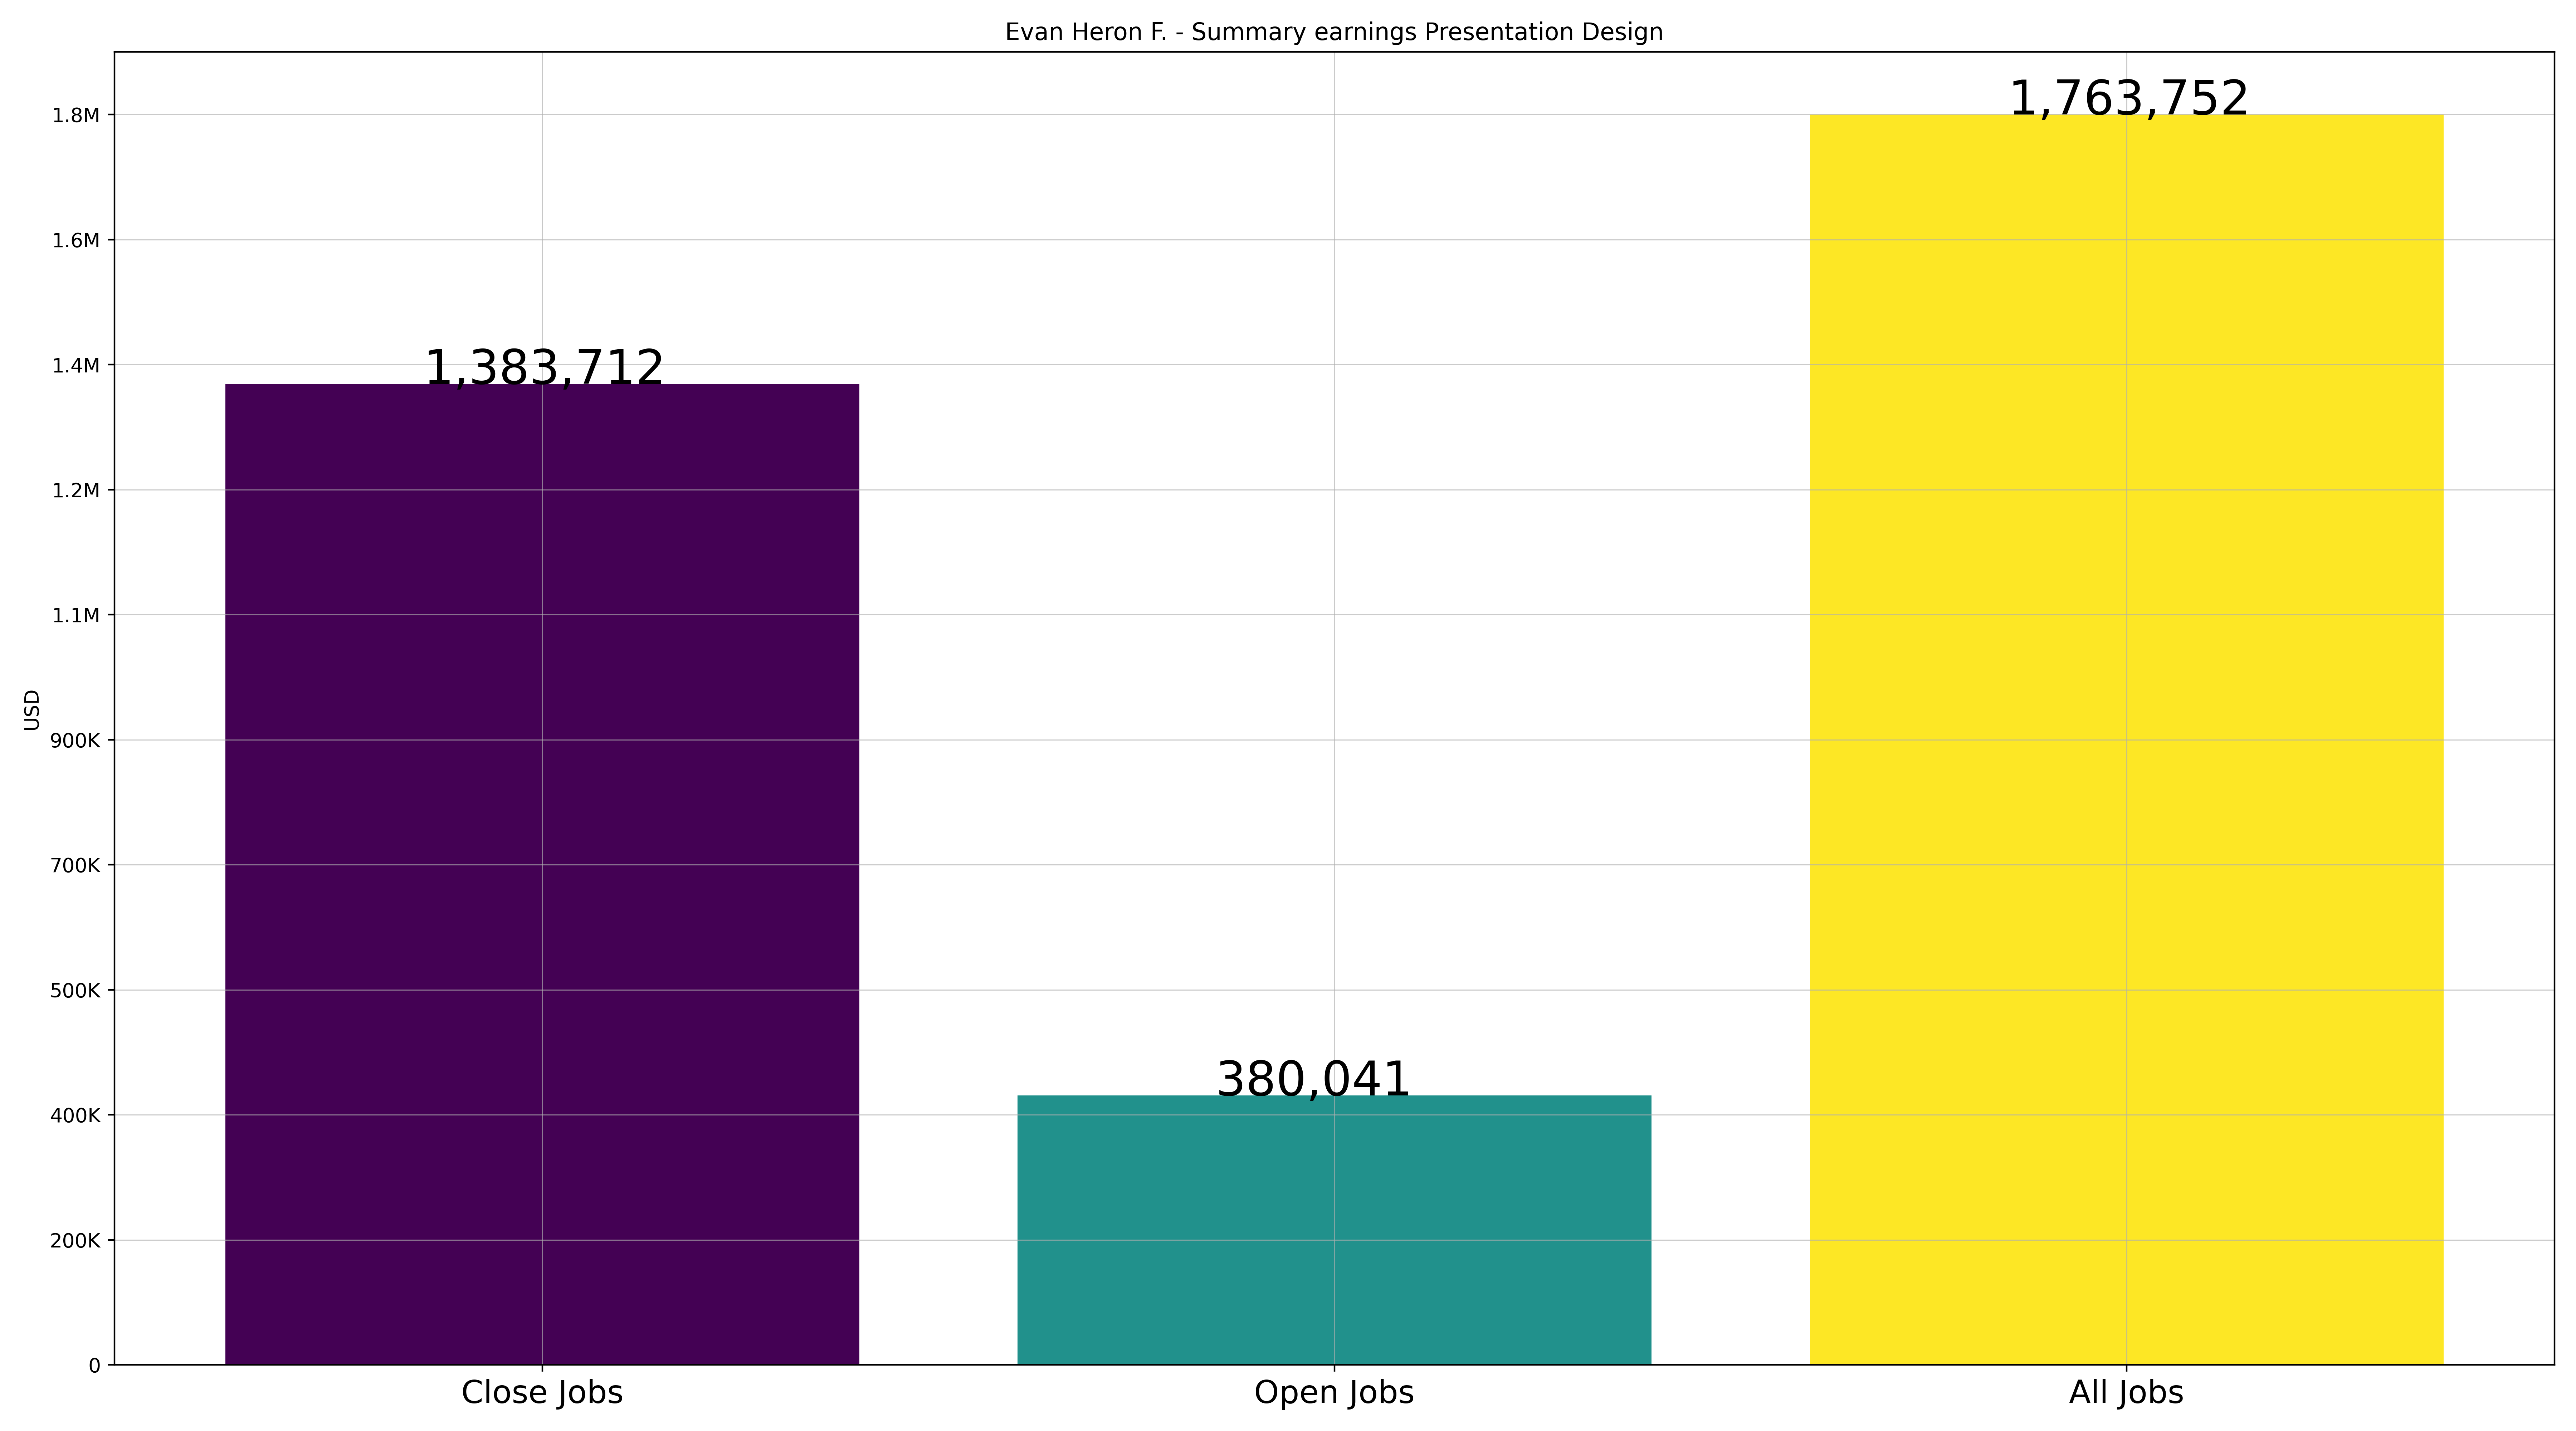
- Closed projects - 1383711.85 $
- Open projects - 380040.51 $
- All projects - 1763752.36 $
Yearly progress hourly rate Presentation Design
It allows to understand competitor hourly rate fluctuation through whole career.

Revenue
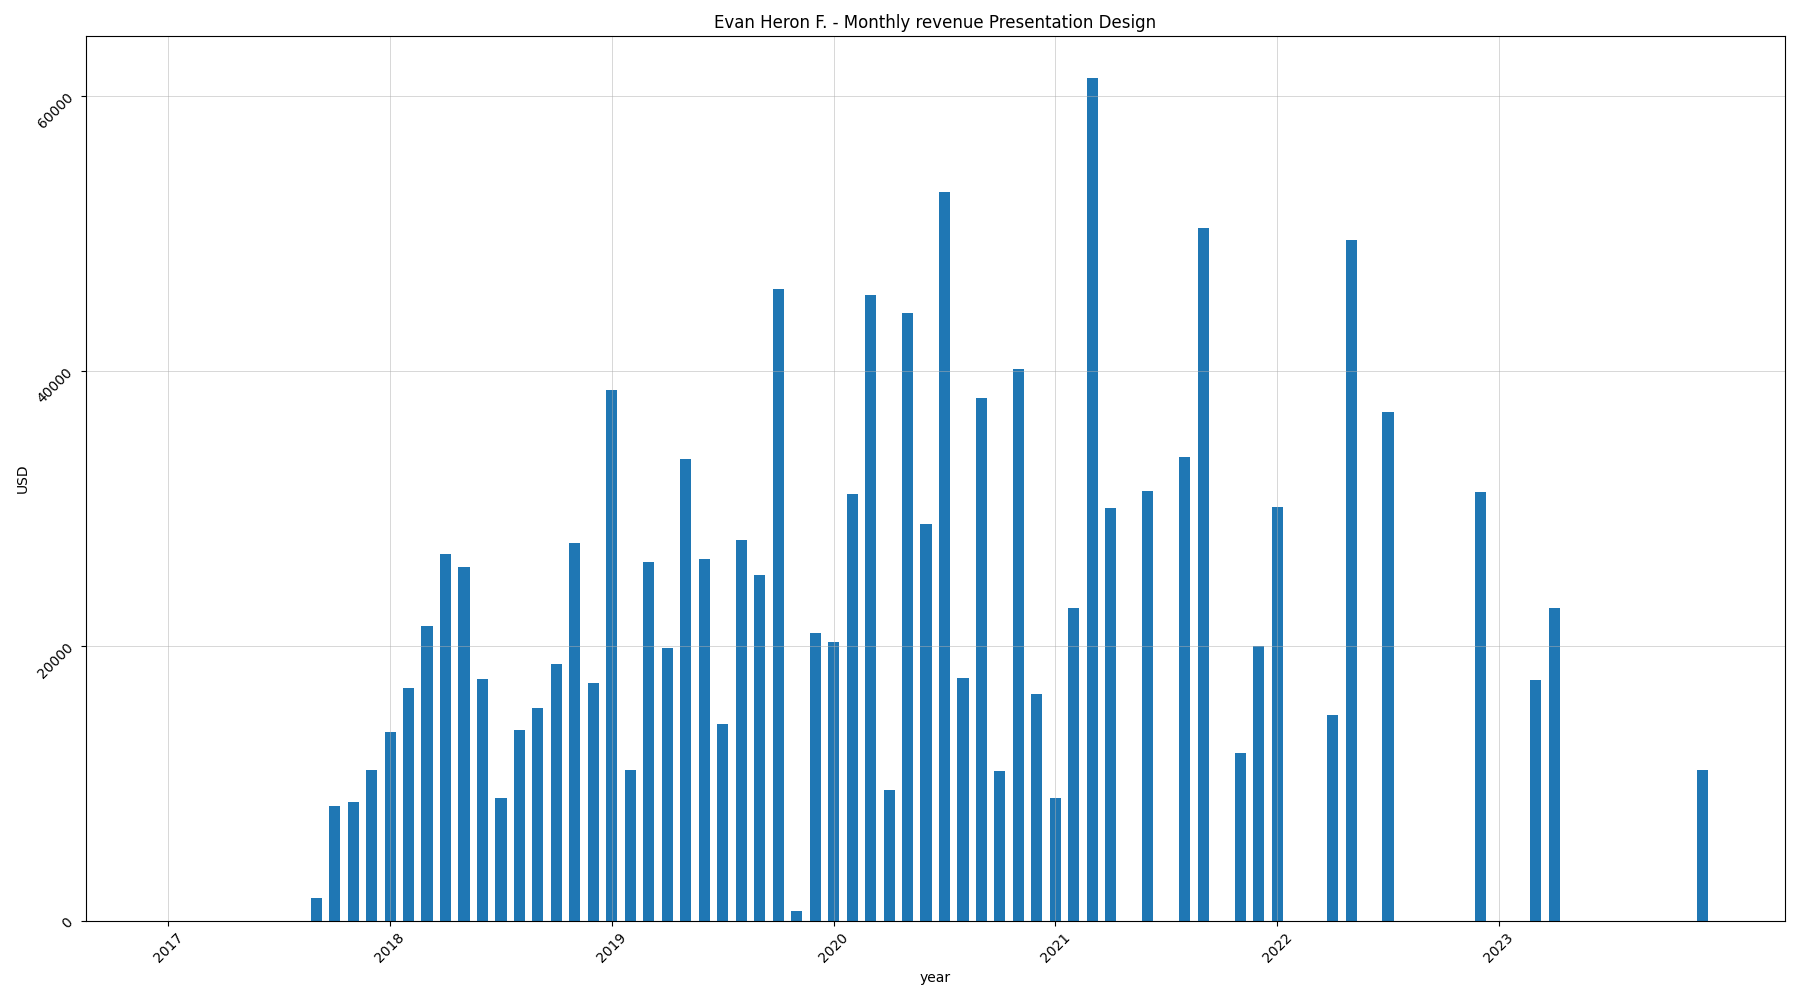
Monthly revenue Presentation Design
Decomposition of lifetime revenue monthly.
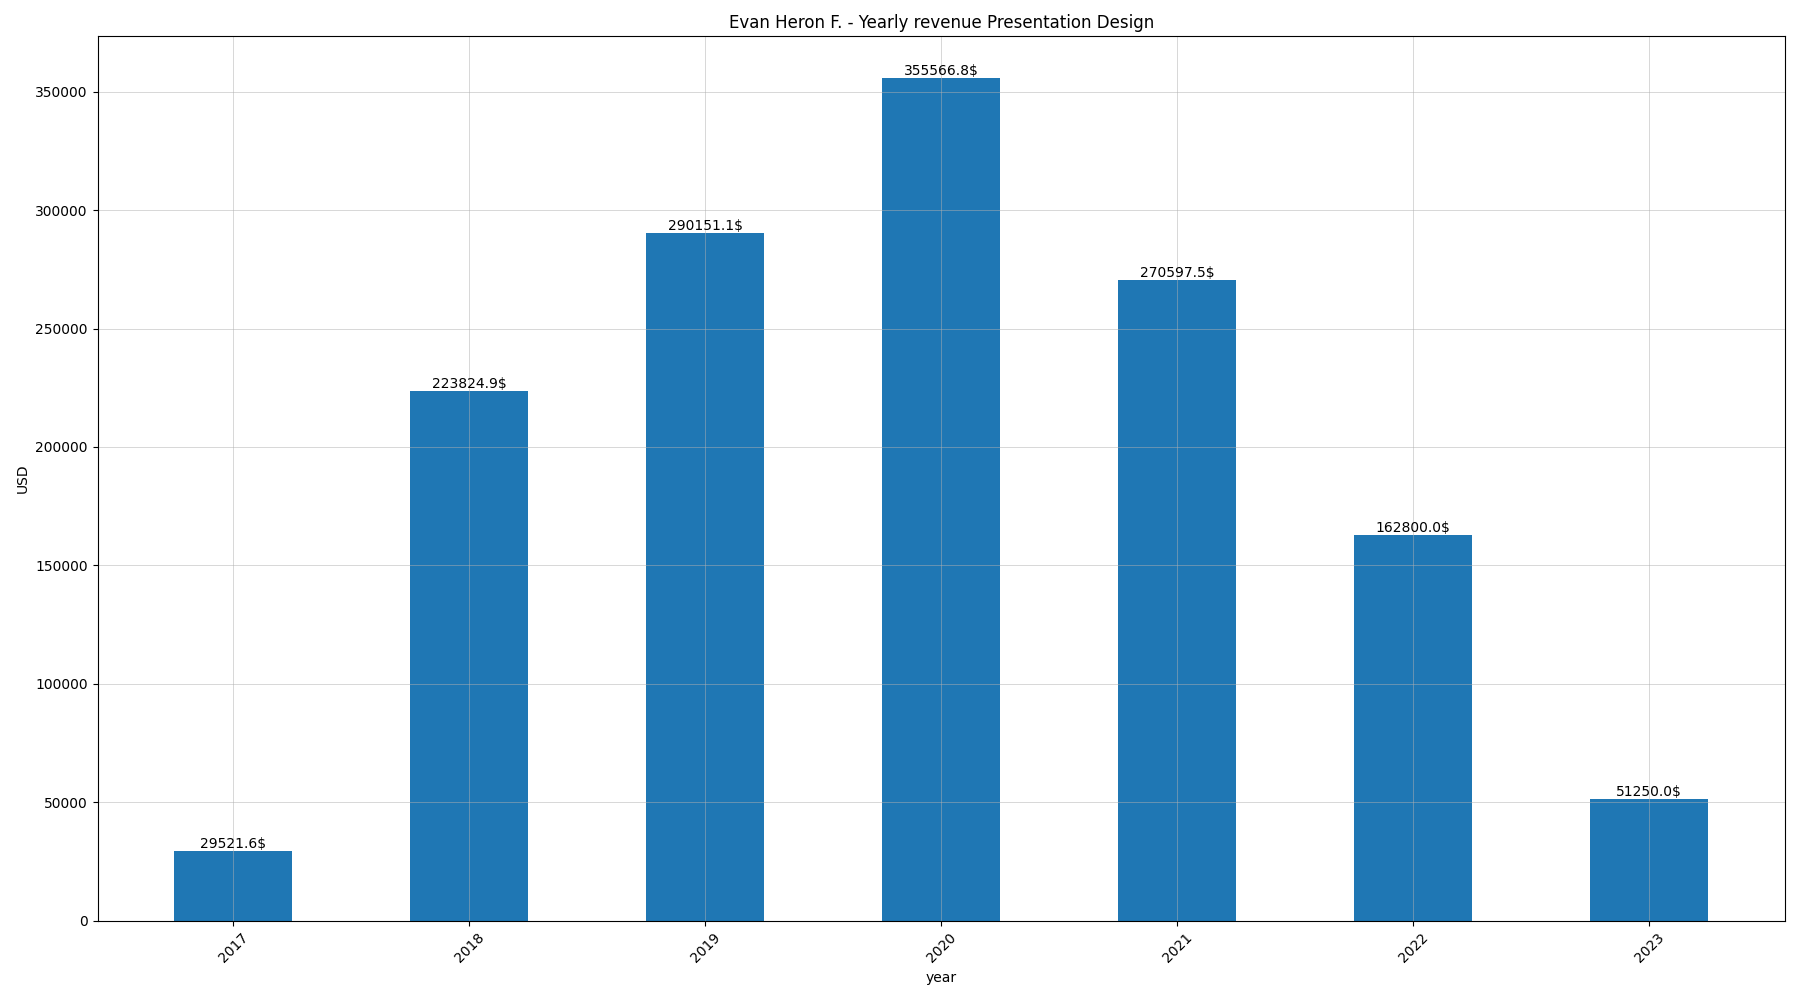
Yearly revenue Presentation Design
Decomposition of lifetime revenue yearly.
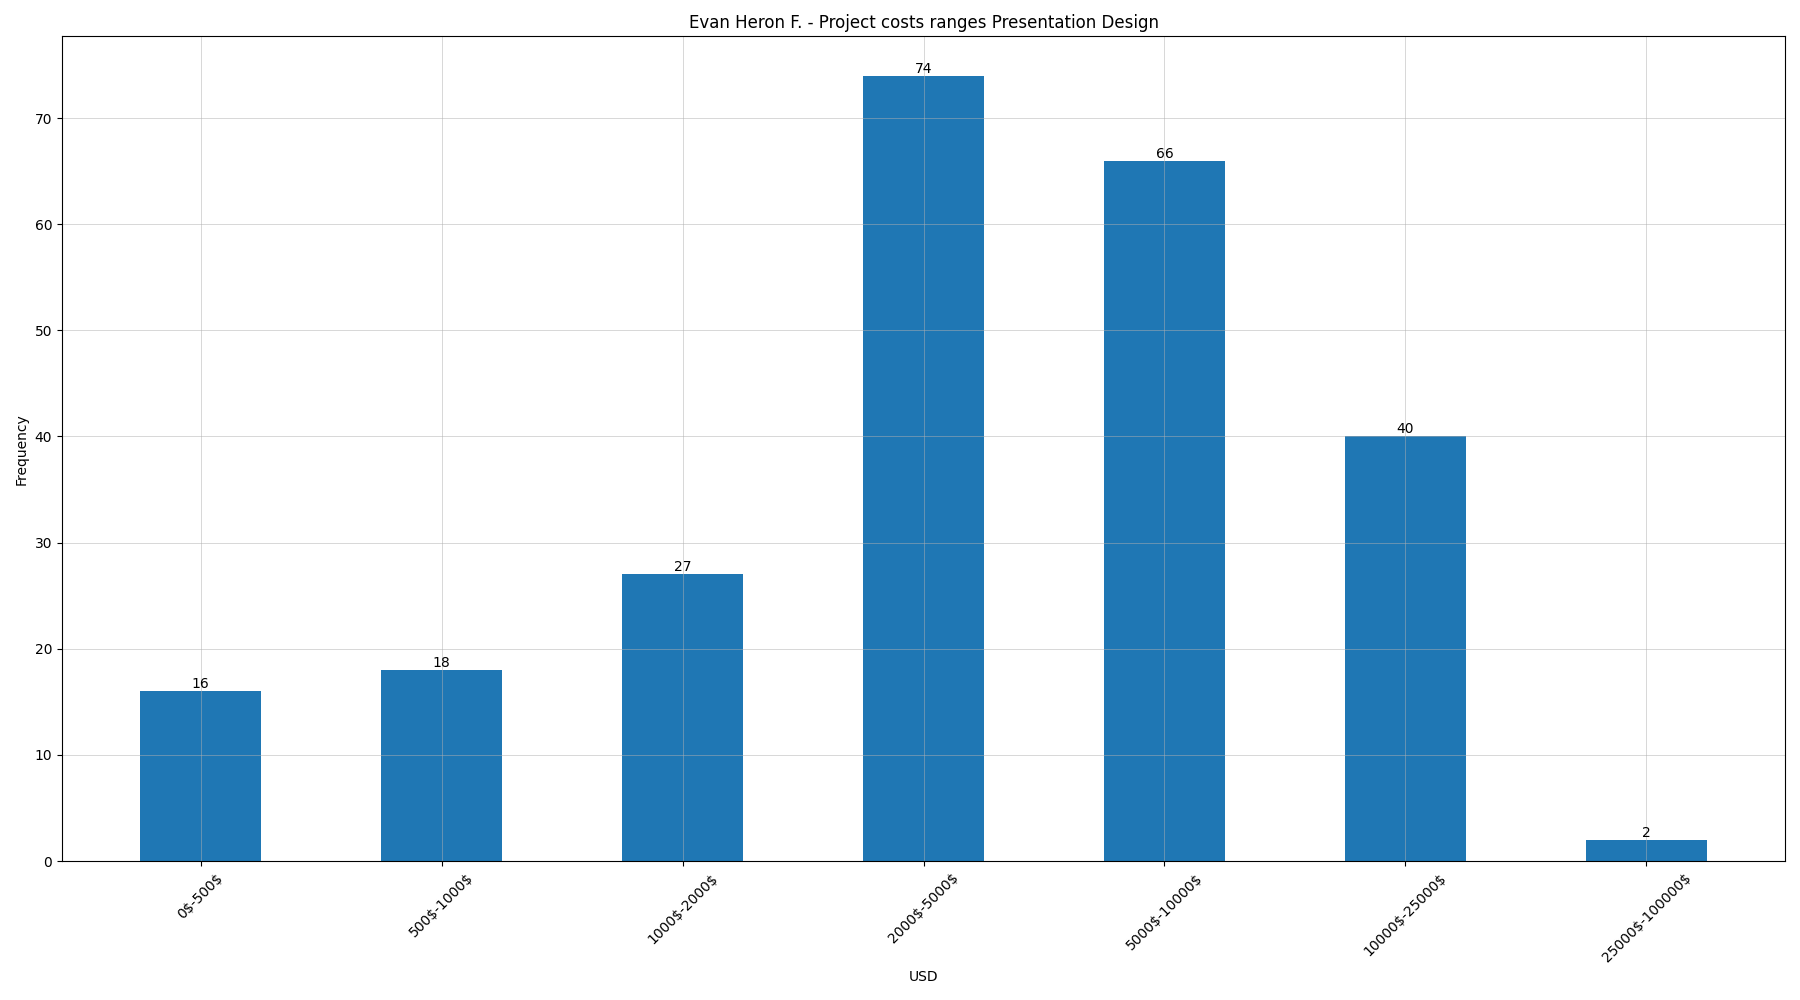
Project costs ranges Presentation Design
Here we can see financial ranges in which competitor was operating through all his career.
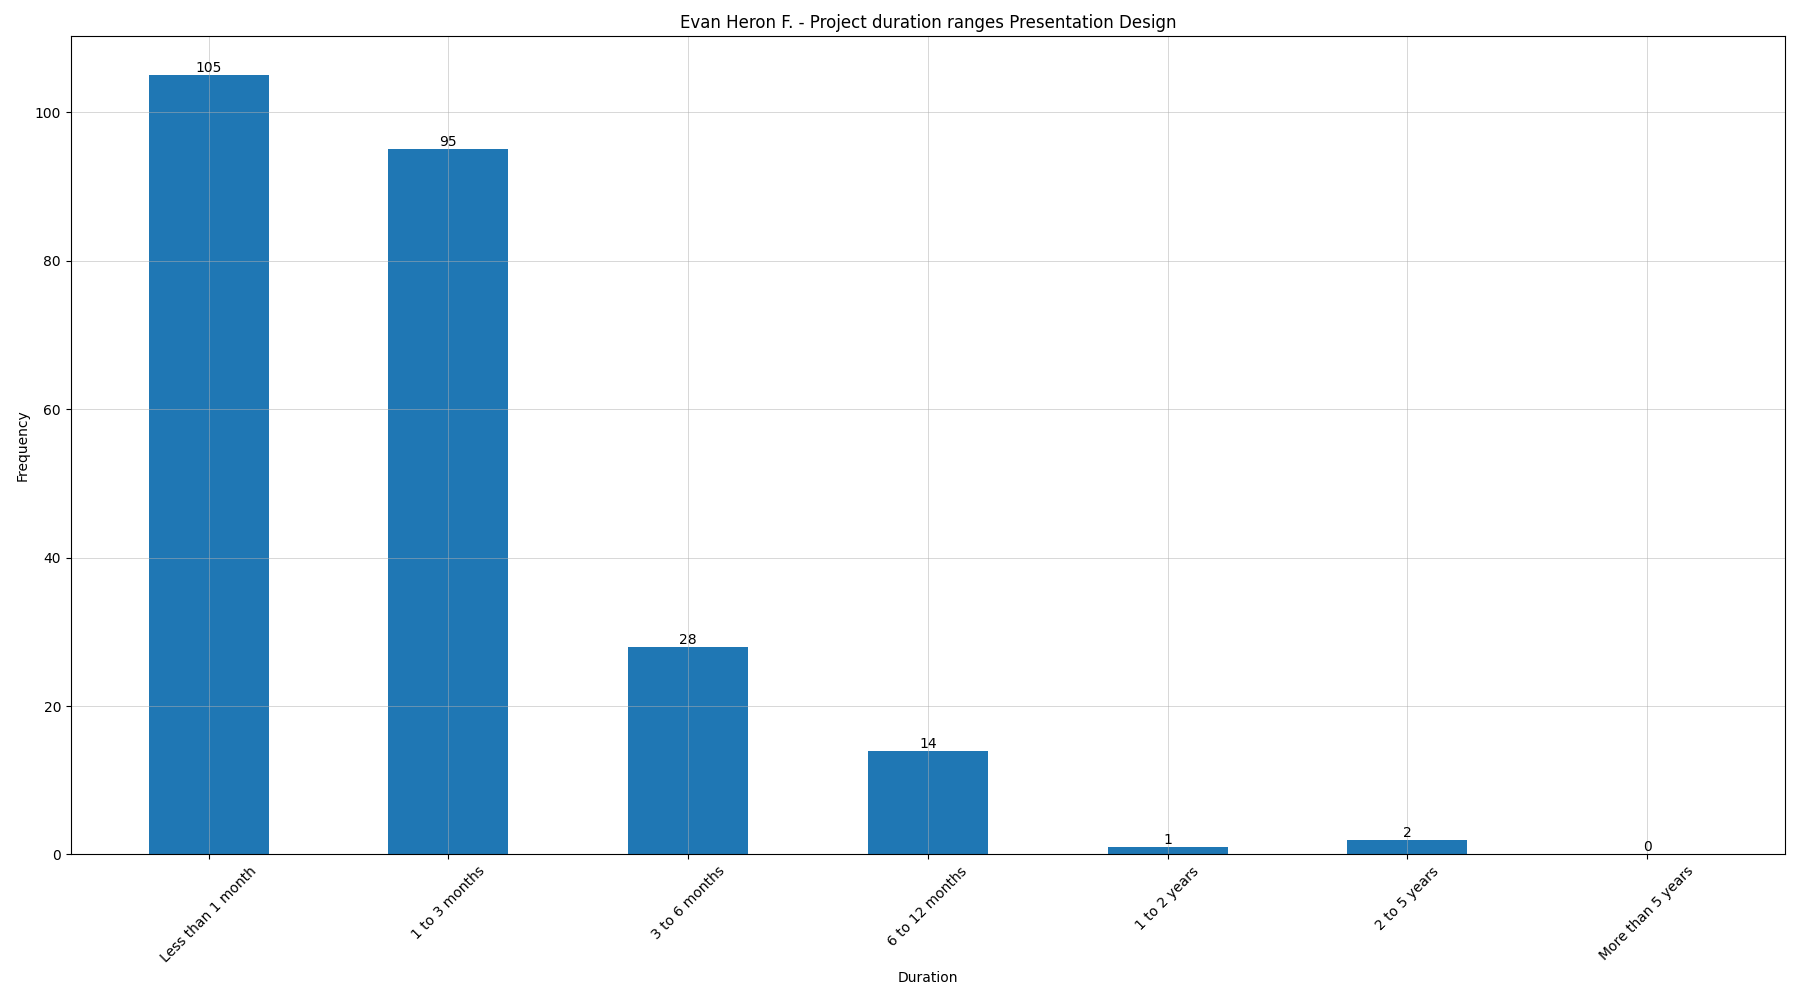
Project duration ranges Presentation Design
Distribution of relationship length with clients. gives us ability to create assumption about competitor customers LTV.
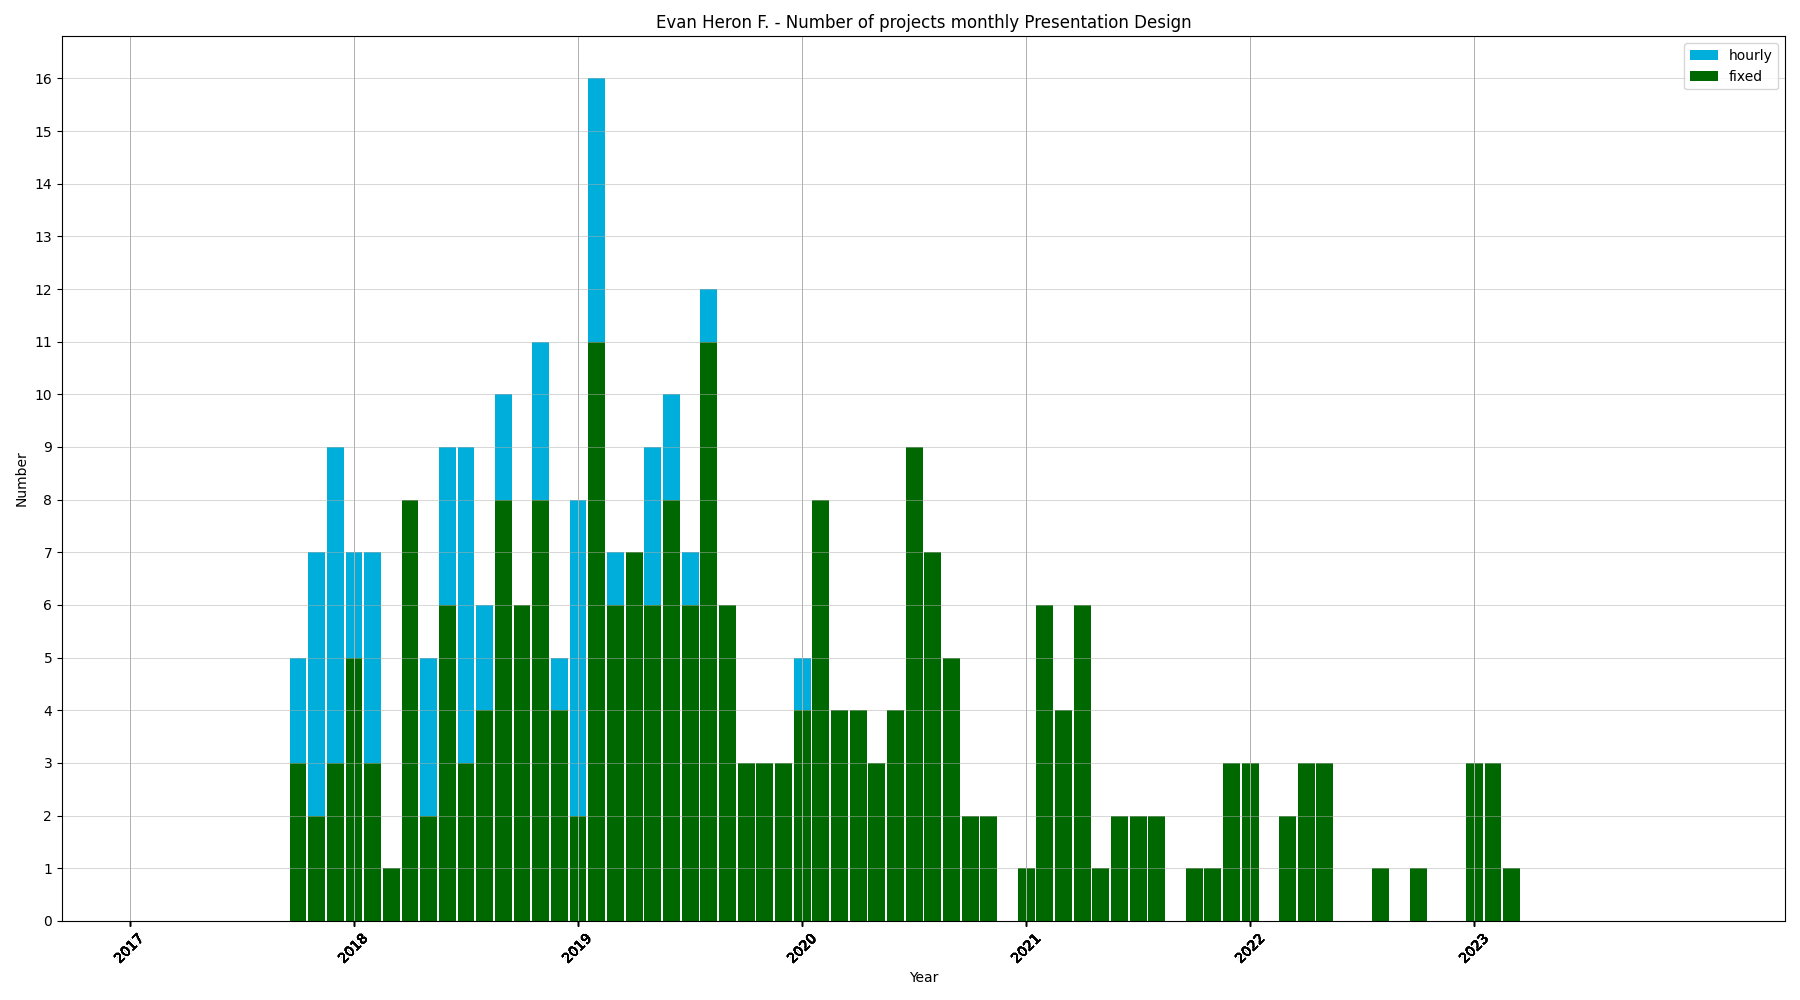
Project involvement dynamics
Project involvement studies are designed to provide you with an understanding of your competitors' business model preferences and project bandwidth.
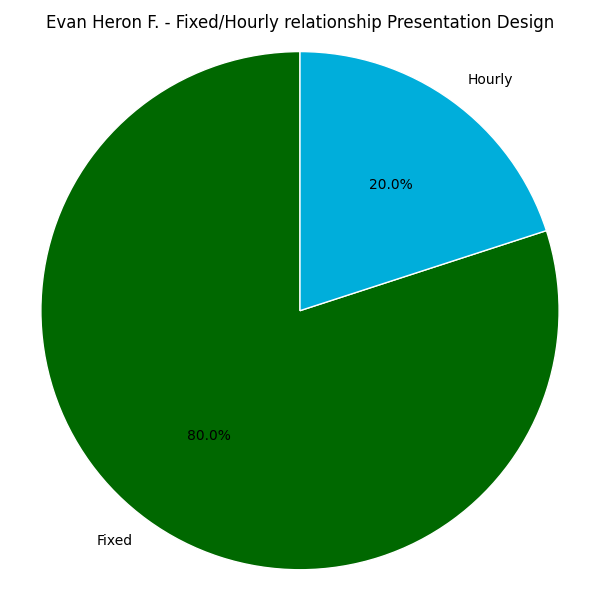
Fixed/Hourly relationship Presentation Design
Number of projects monthly Presentation Design
Number of projects yearly Presentation Design